
Adoption is nearly universal and spending has tripled, yet most projects return nothing. Here is where artificial intelligence pays for itself, where it stalls, and how the organizations that profit decide what to build.
| Figure | What it measures |
|---|---|
| 88% | Organizations using AI in at least one business function in 2025 |
| $37B | Enterprise spending on generative AI in 2025, triple the 2024 figure |
| 95% | Generative AI pilots that show no measurable profit-and-loss impact |
| 40% | Share of enterprise apps projected to carry AI agents by the end of 2026 |
The question facing most companies in 2026 is no longer whether to use artificial intelligence. That decision has effectively been made across the economy. According to McKinsey's State of AI research, 88 percent of organizations reported using AI in at least one business function in 2025, up from 55 percent in 2023. Generative AI alone moved from a third of companies to roughly three quarters in the same window. On the adoption curve, AI is now closer to email than to an emerging technology.
The harder question is what that spending actually returns. An MIT study published in 2025, drawn from more than 300 deployments and 150 executive interviews, found that 95 percent of generative AI pilots produced no measurable impact on the income statement. Both facts are true at the same time: AI is everywhere, and most of the money spent on it is not yet earning a return. This article separates the two by looking at the functions where AI produces measured gains, the reasons so many projects stall, and the pattern that distinguishes the minority that succeed.
Two numbers describe the current moment. The first is reach. Enterprise AI use climbed to 88 percent of organizations in 2025, and the average company now applies it across several functions rather than a single pilot. The second is money. Menlo Ventures estimated enterprise spending on generative AI at 37 billion dollars in 2025, up from 11.5 billion a year earlier and 1.7 billion in 2023. Capital is moving into the category faster than into almost any prior enterprise technology.
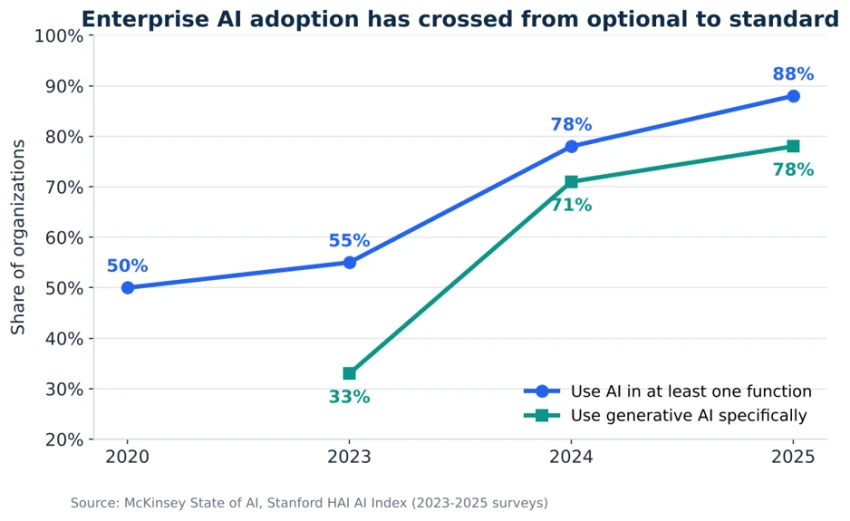
Figure 1. Share of organizations using AI, overall and generative AI specifically, 2020 to 2025.
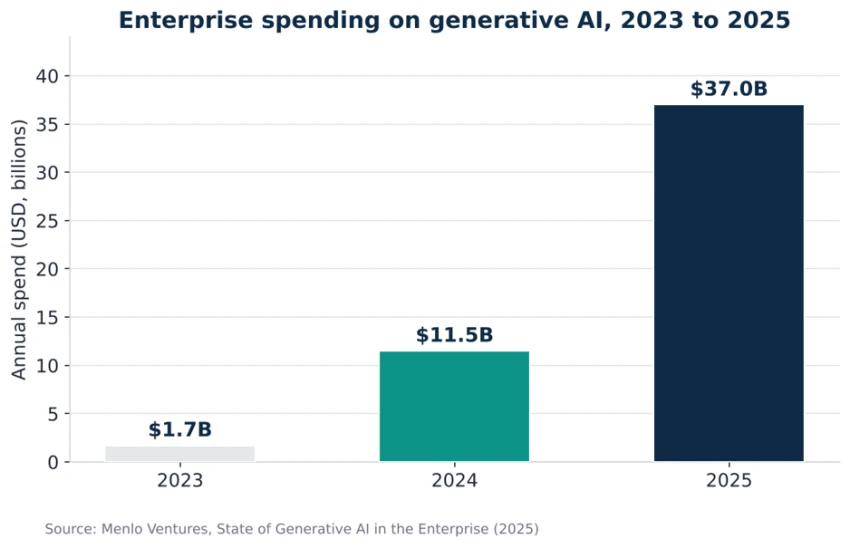
Figure 2. Enterprise generative AI spending has roughly tripled year over year.
Reach and spending, however, are inputs rather than outcomes. The same period that saw spending triple also saw the majority of projects fail to clear the bar of measurable value. The gap between the two is the real story of 2026, and it is driven less by the quality of the models than by how companies choose to apply them. The sections below start with where the returns are concentrated.
Value from AI is not spread evenly across the business. Controlled studies and company disclosures point to a short list of functions where the gains are measurable and repeatable. The common thread is high-volume, well-defined work where output can be checked against a clear standard.
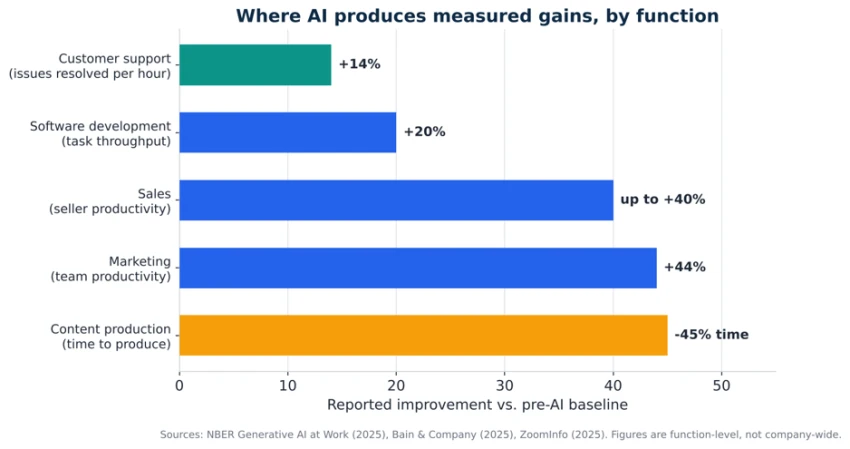
Figure 3. Reported productivity gains by function, measured against a pre-AI baseline.
Customer support is the clearest case. A National Bureau of Economic Research study of more than 5,000 agents found that access to a generative AI assistant raised issues resolved per hour by about 14 percent, with the largest gains going to newer and lower-performing staff. The economics scale sharply at volume. Klarna reported that its AI assistant handled 2.3 million conversations in its first month, equivalent to roughly 700 full-time agents, cutting average resolution time from 11 minutes to under 2 and reducing repeat inquiries by a quarter. Bank of America's virtual assistant has passed 2 billion customer interactions. The lesson most firms miss is that Salesforce estimates two thirds of support time is spent on tasks that never touch the customer, which is precisely the work AI absorbs first.
Marketing and sales show strong productivity gains, though they are also where the most money is wasted (a point the next section returns to). Marketing teams using AI report productivity roughly 44 percent above baseline and save on the order of 11 hours per week, according to ZoomInfo. Bain and Company found that generative AI cuts content production time by 30 to 50 percent. On the sales side, teams adopting AI report productivity gains of up to 40 percent and sales cycles shortened by about a quarter. The value here is real but softer to verify, because revenue is influenced by many factors beyond the tool.
The least glamorous functions tend to post the most durable returns. Finance, compliance, and operations involve structured, rules-based work that AI handles reliably and where outcomes are easy to audit. JPMorgan's contract intelligence platform reclaims an estimated 360,000 lawyer-hours each year by reviewing documents in seconds that once took hours. The bank now runs more than 450 AI use cases in production. MIT's research reached the same conclusion from the opposite direction: the most consistent successes it found were in back-office functions, not in the high-visibility areas that attract the most attention.
Engineering was one of the earliest functions to see measurable lift. Bain's survey of financial services firms found average productivity gains near 20 percent across software development and related work. Adoption is broad, with more than 50,000 enterprise organizations now using GitHub Copilot at the business or enterprise tier. As with support, the gains concentrate in routine work: boilerplate, tests, and documentation rather than novel system design.
| Function | Primary value driver | Evidence strength |
|---|---|---|
| Finance and operations | Cost and error reduction | High |
| Customer support | Cost reduction plus faster resolution | High |
| Software development | Throughput on routine work | Medium to high |
| Marketing | Output volume and speed | Medium |
| Sales | Seller time and cycle length | Medium |
If the gains are this clear, the 95 percent failure rate demands an explanation. MIT's work attributes it not to weak models but to how companies deploy them. Two patterns do most of the damage.
The first is building instead of buying. AI tools purchased from specialist vendors reached production at roughly double the rate of systems built in-house. Internal IT-led builds tend to underestimate the cost of integration and stall in pilot, while vendors that focus on a specific workflow clear the last mile more often.
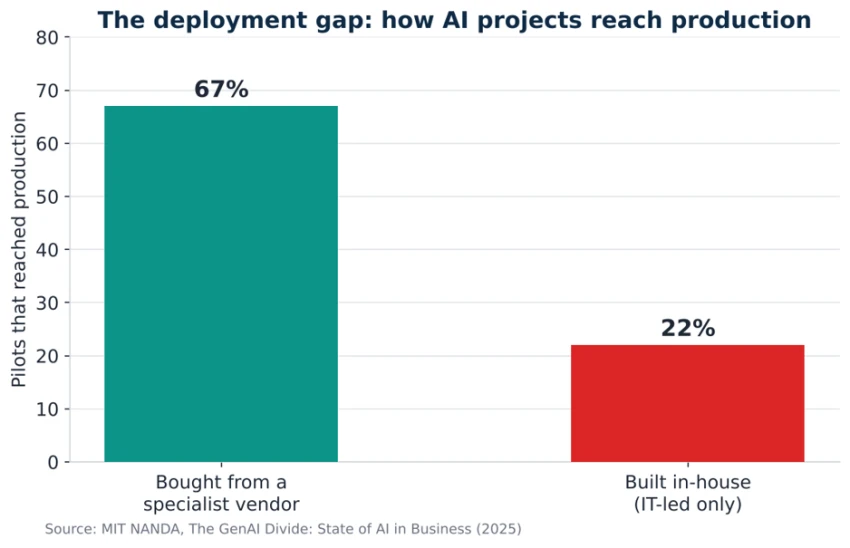
Figure 4. Share of pilots reaching production, by how the AI was sourced.
The second pattern is spending in the wrong place. More than half of 2025 AI budgets went to sales and marketing, the functions with the highest visibility but, as the evidence above shows, softer and slower returns than back-office automation. Capital flows toward the demo that impresses in a meeting rather than the process that quietly saves money. MIT also identified a shadow AI economy that compounds the mismeasurement: workers at more than 90 percent of surveyed organizations use personal AI tools regularly, while only about 40 percent of companies pay for enterprise subscriptions, so much of the real usage never appears in any ROI calculation.
The through-line is that AI rarely fails on capability. It fails when it is treated as a technology purchase rather than a change to how work is done. IBM's research found that only about 16 percent of AI initiatives scale beyond the pilot stage, and the ones that stall usually do so because they were never integrated into a daily workflow that someone owns.
The organizations that extract measurable value tend to share four habits. None of them is about having a better model.
Start where the work is repetitive. Narrow, high-volume tasks first, not broad transformation. The successful pilots target a bounded problem with clear inputs and a checkable output, such as tier-one support tickets or contract review, rather than attempting to reinvent a whole department at once.
Buy before you build. Specialist vendors reach production roughly twice as often as internal builds. Building makes sense only where the workflow is genuinely proprietary and the team can own long-term integration and maintenance.
Measure the outcome, not the usage. The firms that succeed track a business outcome, not AI activity. JPMorgan counts lawyer-hours saved, Klarna counts repeat inquiries avoided. Counting prompts or logins tells you nothing about return.
Keep people on the escalation path. Klarna's widely cited deployment was later refined to route complex cases back to people. The durable model is AI for volume and humans for the exceptions, with a clean handoff between them.
These are governance and design choices rather than technical ones, which is why the failure rate persists even as the underlying models improve.
The capability moving fastest in 2026 is agentic AI, meaning systems that carry out multi-step tasks and take actions rather than only generating text in response to a prompt. Gartner projects that 40 percent of enterprise applications will include task-specific AI agents by the end of 2026, up from less than 5 percent in 2025. McKinsey's late-2025 survey found 62 percent of organizations at least experimenting with agents, though confirmed production deployment remains in the single digits for most functions.
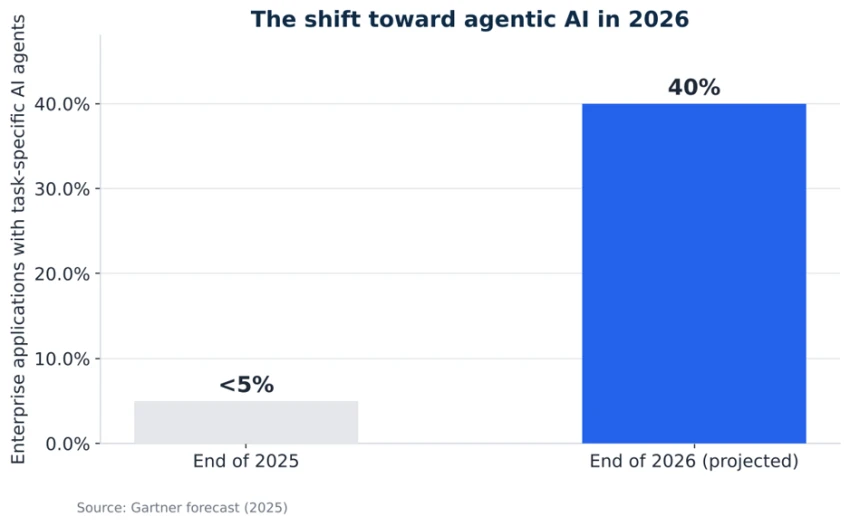
Figure 5. Projected share of enterprise applications carrying task-specific AI agents.
Early production examples follow the same rule that governs the rest of the field. ServiceNow reports that its agents resolve about 80 percent of support inquiries autonomously, tied to an estimated 325 million dollars in annualized value. The deployments that work are bounded, measured against a business metric, and backed by a human escalation path. Agents raise the ceiling on what AI can do without changing the discipline required to make it pay.
For a company deciding where to apply AI in 2026, the evidence points to a consistent sequence: begin in a function with high volume and verifiable output, buy a specialist tool, and tie it to a metric the finance team already tracks. The table below maps that logic across common functions.
| Function | Where to start | What to measure | Typical time to ROI |
|---|---|---|---|
| Customer support | Tier-one tickets and FAQs | Resolution time, repeat contacts | Weeks to months |
| Finance and legal | Document and contract review | Hours saved, error rate | 3 to 9 months |
| Software | Tests, boilerplate, docs | Task throughput, cycle time | Weeks to months |
| Marketing | Drafting and content variants | Output volume, time saved | 1 to 6 months |
| Sales | Research and outreach prep | Selling time, cycle length | 3 to 6 months |
The hype around AI in 2026 is loud enough to obscure a fairly settled reality. The technology delivers reliable, measurable value in a handful of functions when it is aimed at well-defined work, bought rather than over-engineered, and judged by a business outcome. It delivers very little when it is bought for visibility and left disconnected from how work actually gets done. The dividing line between the two is not the model. It is the decision about where to point it.
Share your thoughts about this article.
Be the first to post a comment!