The same tool can be a 4.7 on one site and a 3.9 on another. Here is what is really going on, and how to read past it.
Here is a small experiment worth trying. Pick any popular AI tool, then look it up on G2, Capterra, Trustpilot, TrustRadius, and Gartner Peer Insights one after another. The scores almost never line up. One site crowns it a near-perfect darling, another parks it in the mediocre middle, and a third barely has enough reviews to say anything at all. Same product, same month, wildly different verdicts.
This is not a glitch, and it usually is not fraud either. Review sites disagree because they are measuring different things, from different crowds, using different math, and cleaning the data with very different levels of rigor. Once you understand the machinery, the disagreement stops being confusing and starts being useful. It turns out the gap between two scores often tells you more than either score on its own.
And this matters more than it used to, because buyers no longer trust a single number. Roughly 74% of consumers now check at least two review sites before deciding, and 59% look at more than two. Nobody stops at one score anymore, which means the contradictions between sites land squarely in front of the person trying to make a decision.
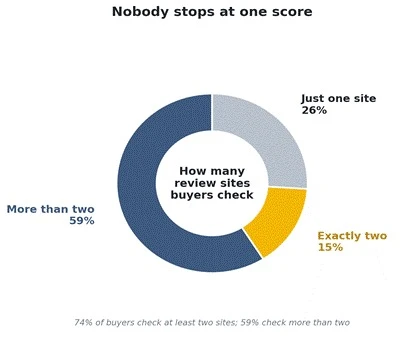
Figure 1. How many review platforms buyers consult before choosing. Source: BrightLocal-based consumer review data, 2025.
The chart below is an illustrative example rather than a real product, but it captures the everyday reality. A tool sits at 4.7 on Capterra, 4.6 on G2, drifts to 4.2 on Trustpilot, and slides to 3.9 on TrustRadius. Average them together and you get 4.28, a number that describes none of the individual sites and hides the whole story.
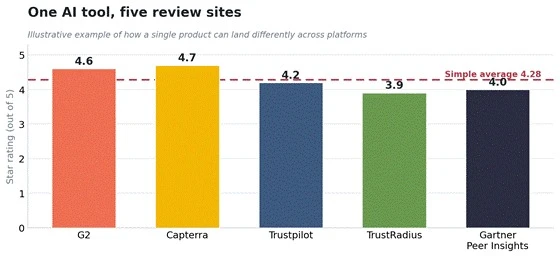
Figure 2. One product, five platforms, five different verdicts. The dashed line is the naive average that flattens all the nuance away.
The instinct is to ask which site is right. That is the wrong question. A better one is: why would honest, well-run platforms land this far apart on the same tool? The answer comes down to six mechanisms, and every one of them is doing exactly what it was designed to do.
Each platform attracts a different slice of the market, and different users want different things from the same software. G2 and Capterra skew toward small and mid-sized businesses doing fast, self-serve research. TrustRadius and Gartner Peer Insights pull in enterprise buyers and IT decision-makers who care about security, integrations, and support at scale. A tool that delights a solo marketer can frustrate an enterprise admin, so the same product genuinely earns different scores from different rooms. Neither room is wrong. They are just grading different report cards.
Some platforms reward people for writing reviews, and that quietly reshapes the results. G2 permits incentivized reviews, commonly through gift cards, with incentives capped in the region of $100, and Capterra has historically offered gift cards in the $10 to $40 range. TrustRadius generally prohibits incentives, and Gartner Peer Insights runs the strictest verification of the group, validating that reviewers are real end users at real companies. Paid-for reviews are not automatically fake, but incentives tend to nudge the average upward and pull in a different, often sunnier, set of voices than an unpaid platform collects.
A score is only as trustworthy as the reviewers behind it. G2 leans on professional identity checks such as LinkedIn verification. Capterra has historically been lighter-touch on verification. TrustRadius and Gartner Peer Insights demand more proof that a reviewer actually used the product in a real business. Stricter gates mean fewer but sturdier reviews, which is why a rigorously verified platform can show a lower, and arguably more honest, number than a high-volume site that lets more marginal reviews through.
Not every site simply averages the stars. Many apply a weighting scheme so that a product with a handful of glowing reviews does not outrank one with thousands of solid ones. A common approach is a Bayesian, or weighted, average that pulls thinly-reviewed products toward the overall mean until they earn enough reviews to stand on their own. The worked example below uses the classic weighted-rating formula with an assumed baseline. Two products both post a raw 4.8, but the one with only eight reviews gets smoothed down to 4.11, while the one with eight hundred reviews barely moves.
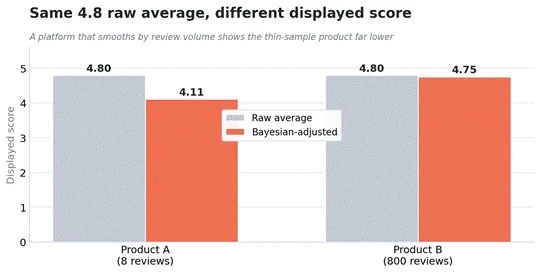
Figure 3. Raw average against a Bayesian-adjusted score. A site that smooths by volume will show a thinly-reviewed tool far lower than a site that displays the raw mean.
This single design choice explains a lot of cross-site disagreement. A platform showing raw averages flatters new tools with few reviews; a platform that smooths by volume treats them with suspicion. Same underlying reviews, different published score.
Software changes fast, and reviews age badly. A verdict written before a major redesign can be actively misleading a year later. Buyers feel this too: most trust reviews from the last month far more than older ones, and a large majority consider anything older than three months close to irrelevant. Platforms handle this differently. Some fade or discount older reviews, some show a rolling recent window, and some let a five-year-old rave keep propping up the lifetime average. A site that emphasizes recent sentiment will diverge from one that treats every review as equal, forever.
Finally, business models leak into scores. Several directories earn money by selling buyer leads to vendors or by charging for placement, which creates a gentle pressure toward keeping listed vendors happy. Vendors also run active campaigns to gather positive reviews on the platforms that matter most to them, so a tool can look stronger on the site where its marketing team is most focused. This is exactly the terrain regulators have moved into, which is the next piece of the puzzle.
| Platform | Typical audience | Incentives | Verification | Reputation for depth |
| G2 | SMB and mid-market | Allowed, capped near $100 | Professional identity | Broad, high volume |
| Capterra | SMB, top-of-funnel | Gift cards, historically light | Historically lighter | Wide catalog, quick scan |
| TrustRadius | Enterprise evaluators | Generally prohibited | Rigorous | Long, detailed reviews |
| Gartner Peer Insights | Enterprise IT buyers | Prohibited, monitored | Strictest, analyst-adjacent | High trust, smaller samples |
| Trustpilot | General consumer | Open, invitation or organic | Varies | Volume over specialisation |
Table 1. How the major software review platforms differ. Characteristics summarised from platform documentation and independent 2025 to 2026 comparisons.
Underneath all six mechanisms sits a deeper statistical quirk that affects every platform. People do not review software at random. Two well-documented biases skew the pool. Acquisition bias means the people who buy a tool already liked it enough to choose it, so the crowd is friendly before anyone types a word. Underreporting bias means the people who bother to write tend to sit at the extremes: thrilled or furious. The quietly satisfied majority in the middle rarely shows up.
The result is the well-known J-shaped distribution of online reviews, formally documented in information systems research: a tall spike at five stars, a smaller bump at one star, and a thin, neglected middle. Because the shape is lopsided, the plain average becomes a biased estimator of true quality. Tellingly, when researchers force every buyer to review, the lopsided shape flattens into a normal curve, which proves the distortion comes from who self-selects to speak, not from the product itself.
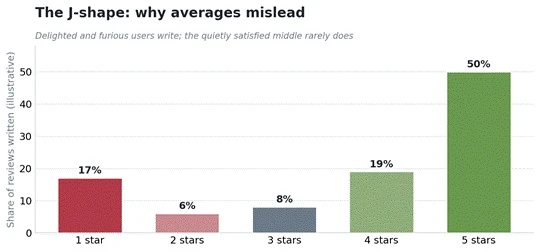
Figure 4. The J-shaped review distribution. The middle is real; it just stays silent. Pattern documented in Hu, Pavlou and Zhang, MIS Quarterly, 2017.
Now layer this onto the six mechanisms. Each platform captures a slightly different tail of that J. A site heavy on incentivized reviews gathers more of the mild-positive crowd; a site favored for venting collects more of the angry tail. Same product, different slice of the same skewed curve, different average. The disagreement was almost inevitable.
For years, the shadier corners of the review economy went unpoliced. That changed in the United States when the Federal Trade Commission finalized a rule specifically targeting fake and deceptive reviews. It took effect on 21 October 2024, and it reaches several of the exact behaviors that push scores apart.
• Fake and AI-generated reviews. Creating, buying, or selling reviews from people who never used the product, including AI-generated ones, is prohibited.
• Sentiment-conditioned incentives. Businesses may not offer compensation conditioned on a review expressing a particular sentiment, whether positive or negative.
• Undisclosed insider reviews. Reviews from employees, officers, or their relatives must clearly disclose the connection.
• Review suppression. Selectively burying or removing honest negative reviews to inflate a score is barred.
• Fake independence. A company may not pass off a site it controls as an independent source of reviews.
The rule has teeth: civil penalties can reach tens of thousands of dollars per violation, and the FTC opened its first enforcement sweep by warning a batch of companies. For buyers, the takeaway is practical. Platforms with stricter verification and no sentiment-linked incentives were already closer to compliance, which is another reason their scores can look tougher than the incentive-friendly sites. Over time, expect the gap between rigorous and lax platforms to matter even more.
Put all of this together and a simple practice falls out. Do not average the platforms; triangulate them. Here is a checklist that turns the disagreement into signal.
| What to check | Why it matters | The move |
| Review count, not just the star | A 4.9 from 11 reviews is noise; a 4.4 from 4,000 is signal | Trust volume-backed scores over thin samples |
| Audience match | Enterprise and SMB grade different things | Weight the platform whose crowd looks like you |
| Recency | Old raves can hide new problems | Read the last few months, ignore ancient five-stars |
| The 3-star reviews | The honest middle lives here, not at the extremes | Read these first; they name real trade-offs |
| Incentive and verification policy | Gifts and weak checks inflate averages | Discount sunny scores on incentive-heavy sites |
| The gap itself | Divergence points to a segment-specific fit | Ask who loved it and who did not, and why |
Table 2. A triangulation checklist for reading multiple review sites at once.
The counterintuitive part: A flawless score is a warning, not a reward. Only about 10% of consumers say they need to see five stars, and a perfect rating increasingly reads as fake or as too thin to trust. A tool sitting at 4.3 across four well-verified platforms is usually a safer bet than one showing a lonely 5.0 on a single incentive-friendly site. |
A few habits reliably lead buyers astray. Watching for them is half the battle.
• Averaging the platforms into one number. Blending a rigorous enterprise score with an incentive-heavy consumer score produces a figure that means nothing.
• Chasing the highest star and ignoring the count. A tiny sample can post a spectacular average by pure chance. Volume is credibility.
• Reading only the five-star and one-star reviews. The extremes are the most self-selected and the least representative. The middle is where the truth hides.
• Treating an old review as current. Software from a year ago may not exist in the same form today. Recency is not a detail; it is the point.
• Forgetting who owns the platform. With G2 having acquired Capterra, Software Advice, and GetApp in early 2026, several formerly independent directories now share an owner. Cross-checking against genuinely independent sources matters more, not less.
Star ratings disagree across review sites because the sites are not clones of each other. They survey different crowds, pay or forbid pay differently, verify with different strictness, do different math on the results, weight recency differently, and answer to different business models. Layer the J-shaped bias of who chooses to review on top, and identical products were never going to earn identical scores.
So stop hunting for the one true number. Read the review counts, match the audience to yourself, favor recent and well-verified platforms, and pay special attention to the three-star reviews and to the gaps between sites. Treated that way, the disagreement is not a problem to be solved. It is the most honest information the review economy gives you.
Share your thoughts about this article.
Be the first to post a comment!

Here is the number worth pinning above your budget: in Gartner Digital Markets r...
Deepak Mehra1 month ago

What Artlist AI is in 2026Artlist began as a royalty-free music library. By 2026...
Deepak Mehra1 month ago
Most AI tool failures do not announce themselves. There is no crash, no angry em...
Nitin1 month ago

The best AI image generator in 2026 is Nano Banana 2 for speed, FLUX.2 for photo...
Parveen Verma1 month ago

“Useful” is a slippery word for a coding assistant. A tool can be brilliant at o...
Sakshi Dhingra1 month ago

How this comparison was builtEvery price, limit, credit rule and feature stateme...
Sakshi Dhingra1 month ago