⚑ The short version An AI detector returns a probability, not a verdict. This guide walks through a seven-step test you can run on any detector, backed by a rating rubric and published research, so a single number never gets more authority than it has earned. |
An AI detector hands back something that looks decisive: a percentage, a colored label, sometimes a single word like AI or Human. That number feels like a ruling. It is not. It is an estimate produced by a statistical model that carries its own error rate, its own blind spots, and its own biases. Before that estimate is allowed to shape a grade, a hiring call, a published article, or a client relationship, it deserves the same scrutiny any measuring instrument would get.
The stakes are not hypothetical. OpenAI, the company behind ChatGPT, launched its own AI text classifier in January 2023 and quietly retired it roughly six months later, citing a low rate of accuracy. On its own published evaluation, the tool correctly identified about 26 percent of AI-written text while mislabeling human-written text as AI around 9 percent of the time. If the firm with the strongest incentive to make detection work chose to pull its tool, a marketing page promising near-perfect accuracy deserves hard questions.
▸ Who this is for Educators and academic-integrity teams deciding whether a flag justifies action. Editors, agencies, and publishers screening writers and contributors. Anyone buying or trusting a detector whose score could affect a real person. |
No mainstream detector reads intent or checks a registry of what a model wrote. It guesses, based on the shape of the text. Most tools lean on statistical signals such as perplexity, meaning how predictable each next word is, and burstiness, meaning how much sentence length and rhythm vary. Human writing tends to be less predictable and more uneven. A lot of AI writing is smoother and more uniform. The model converts those signals into an internal probability between 0 and 1, then compares that probability against a threshold to produce the label you actually see.
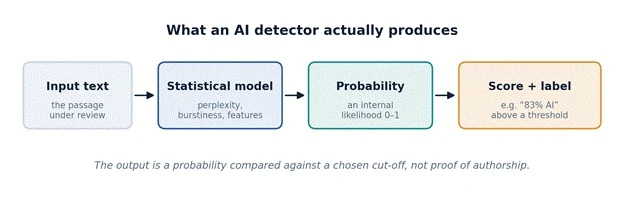
Figure 1. A detector estimates a probability, then compares it to a chosen cut-off. The label is the last step, not the measurement.
Two consequences follow, and both matter for evaluation. First, the score is only ever as trustworthy as the threshold that someone picked. Move the cut-off and the same text changes category. Second, anything that makes genuine human writing look statistically smooth can push a real person into the AI bucket: a non-native English writer with a smaller working vocabulary, a heavily edited house style, a template, or simply a short passage.
⚠ The bias that broke trust A Stanford study published in Patterns (Liang and colleagues, 2023) ran essays through seven popular detectors. They classified US student essays almost perfectly, yet wrongly flagged 61.3 percent of TOEFL essays written by non-native English speakers as AI. At least one detector flagged nearly 98 percent of those essays. The mechanism was perplexity: limited vocabulary reads as machine-like, so authentic non-native writing gets penalized. |
Every score a detector produces collapses into four possible outcomes. Understanding them is the difference between reading a result and being fooled by one.
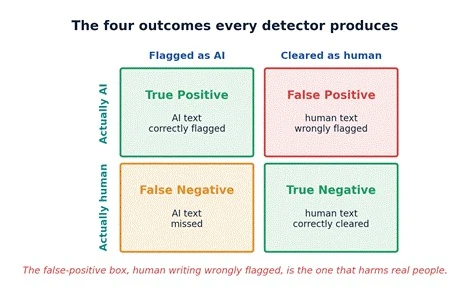
Figure 2. The four outcomes. Vendors love to talk about true positives. The false-positive box is where the damage happens.
From those four outcomes come the handful of metrics that actually tell you whether a detector is any good. A tool can look impressive on one and be dangerous on another, which is exactly why a single headline accuracy figure is close to meaningless on its own.
| Metric | What it measures | Why it matters for trust |
| Accuracy | Share of all cases it gets right | Easy to inflate with an unbalanced test set. Never trust it alone. |
| False-positive rate | How often human text is wrongly flagged as AI | The number that harms real people. The single most important figure to demand. |
| False-negative rate | How often AI text is missed | Tells you how easy the tool is to slip past. |
| Precision | Of everything flagged as AI, how much truly was | Low precision means many innocent flags per real catch. |
| Recall (TPR) | Of all AI text, how much got caught | High recall alone can hide a terrible false-positive rate. |
| TPR at fixed FPR | Catch rate when false positives are pinned low (say 1%) | The honest way to compare detectors on equal footing. |
| Calibration | Whether a 90% score really means 90% likely | Uncalibrated scores invite overconfident decisions. |
| Robustness | Whether the score survives editing or paraphrasing | Determines how the tool holds up against real-world evasion. |
★ The one metric to insist on If a vendor will share only one number, ask for true positive rate at a 1 percent false-positive rate. It answers the real question: how much AI text can this tool catch while almost never accusing a human? In independent testing, several detectors score close to zero on this measure. |
The rest of this guide is a repeatable test. You can run the full version with a proper labelled dataset, or a lightweight version in an afternoon with a few dozen samples. Either way, work through the steps in order. Each one produces a number or a clear yes or no that feeds the scoring rubric later.
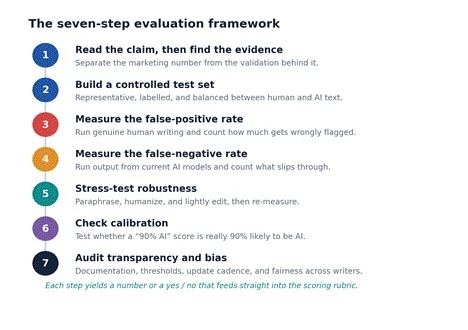
Figure 3. The seven steps, from reading the claim to auditing bias and documentation.
Start with the marketing number, then hunt for what stands behind it. A trustworthy vendor publishes a methodology: which models the AI samples came from, how many human samples were used, where they were sourced, and how the reported false-positive rate was measured. A weak vendor gives you a percentage and a testimonial. Treat any headline accuracy figure without a linked methodology as unverified.
✓ Ask for these five things
|
You cannot judge a detector on the samples it was tuned to pass. Assemble your own set that mirrors the writing you actually care about. Include genuine human text you can verify was written before modern chatbots existed, output from the AI models people around you really use, and a mix of lengths. Length matters more than most people expect: many vendors admit reliability drops sharply on short passages, and OpenAI itself warned its classifier was unreliable below about 1,000 characters.
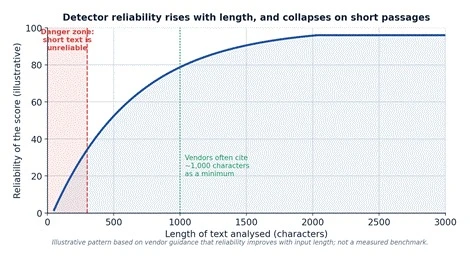
Figure 4. Reliability climbs with length and collapses on short text. Screening a single paragraph is far riskier than screening a full essay.
Aim for balance. If your set is 90 percent human text, a lazy detector that flags almost nothing will post a flattering accuracy score while being useless. A rough target of a few hundred samples, split evenly, with subgroups for length and for non-native writers, is enough to expose most problems.
This is the most important test in the guide. Feed the detector only verified human text and count how much it wrongly flags. Do it separately for each subgroup, because averages hide the harm. A tool can post a 2 percent false-positive rate overall and still flag a quarter of writing from one group. Published false-positive figures range from vendor claims near 1 percent to independent results many times higher, which is exactly why you measure it yourself rather than trust the brochure.
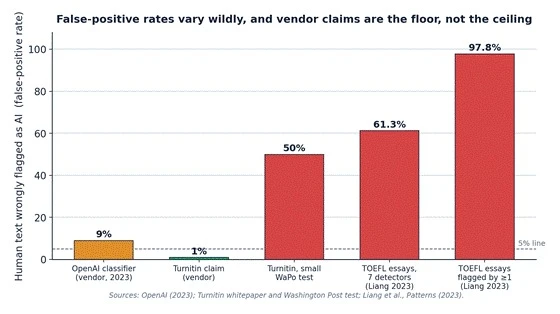
Figure 5. Reported false-positive rates span two orders of magnitude. Vendor claims tend to be the floor, not the ceiling.
⚑ Decision rule Decide your tolerance before you see the results. For consequential decisions about individuals, a false-positive rate above a few percent on any subgroup should disqualify the tool as a sole basis for action. |
Now test the other direction. Generate text from the models people actually use today, not the ones from two years ago, and count how much slips through as human. Detection is an arms race, and a tool trained on last year's models often misses this year's. A detector that was excellent at launch can quietly decay as generation improves, which is why the update cadence from Step 1 matters so much here.
A score that only holds for raw, unedited output is close to worthless, because almost no one submits raw output. Take your AI samples and run them through the tactics real users apply: a paraphrasing pass, a so-called humanizer tool, or a few minutes of manual editing. Then re-measure. This is where most detectors quietly fail.
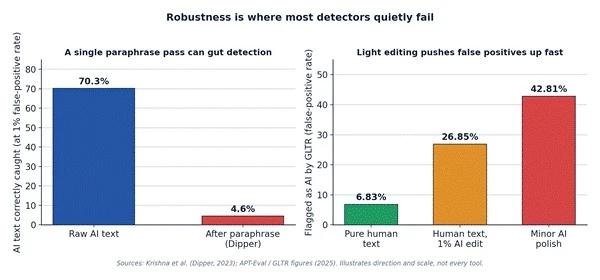
Figure 6. Left: a single paraphrase pass can collapse a detector's catch rate. Right: even light editing of human text drives false positives up fast.
The research is blunt about this. A Google Research paraphraser known as Dipper cut one detector's catch rate from about 70 percent to under 5 percent in a single pass. In the other direction, adding even minor AI polish to human writing pushed one detector's false-positive rate from under 7 percent to over 40 percent. A detector that cannot survive light editing should not be described as reliable, whatever its launch numbers looked like.
Calibration asks a simple question: when a detector says 90 percent, is the text really about 90 percent likely to be AI? Many tools are overconfident, clustering scores near 0 or 100 with little middle ground, which invites black-and-white decisions the underlying evidence does not support. To test it, group your samples by the score they received and check what share in each band truly was AI. A well-calibrated tool tracks the diagonal. Most do not.
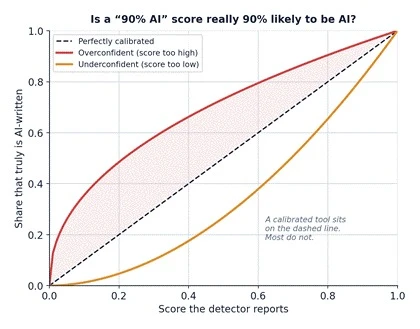
Figure 7. A calibrated detector sits on the dashed line. Overconfident tools sit above it, turning a 70 percent likelihood into a 95 percent score.
The final step is not about numbers, it is about accountability. Look for a public methodology, a changelog, an explicit statement of known limitations, and evidence that the vendor has tested for bias across writer groups rather than hoping it away. A tool that publishes its weaknesses is usually safer than one that publishes only its wins, because the honest vendor is telling you where not to rely on it.
✓ What good documentation looks like A stated false-positive rate, broken down by subgroup, not just a global average. Named limitations: short text, non-native writing, edited or templated content. A changelog showing updates against new AI models. Guidance that the score is one signal, never sole proof. |
Some warning signs let you rule a detector out before you run a single test. If you see several of these together, be skeptical of every number on the page.
| Red flag | What it usually hides |
| “99% accurate” with no methodology | An unbalanced or undisclosed test set chosen to flatter the tool. |
| No false-positive rate published | The number is unflattering, so only accuracy or recall is shown. |
| “Detects all AI, from any model” | A claim no current tool can support against paraphrasing and new models. |
| A score with no confidence range | Overconfidence, and no way to see how uncertain the estimate is. |
| No mention of bias testing | Untested performance on non-native or neurodivergent writers. |
| No changelog or update history | A model that may have decayed as generation improved. |
| Marketing quotes instead of data | An absence of independent, reproducible evaluation. |
To turn seven steps into a single, defensible judgment, score each criterion from 1 to 5, multiply by its weight, and add the results. The weights below put the most emphasis on the things that cause real harm, namely false positives and robustness, and the least on raw catch rate, which is the easiest number to inflate. Adjust the weights to your context, but decide them before you test.
| Criterion | Weight | What a 5 out of 5 looks like |
| Evidence behind the claim | 20% | Public methodology, disclosed test set, independent evaluation. |
| False-positive rate on human text | 25% | Low and stable across every subgroup you tested, not just on average. |
| Detection of current AI models | 15% | Catches output from the models people actually use today. |
| Robustness to evasion | 15% | Holds up after paraphrasing, humanizing, and light editing. |
| Calibration of the score | 10% | Reported probabilities track real likelihoods. |
| Transparency and bias testing | 15% | Documented limits, changelog, and published fairness results. |
| Total | 100% | Weighted score out of 5. Below 3.0, do not use it to decide anything about a person. |
★ How to read the total Multiply each 1 to 5 rating by its weight and sum. A tool scoring 4.0 and above can support decisions with human review. Between 3.0 and 4.0, use it only as a soft signal. Below 3.0, it should not influence any decision about an individual. |
Here are two detectors run through the same rubric. Detector A leads with a flashy headline accuracy number. Detector B is quieter but survives the tests that matter. The figures below are illustrative, meant to show how the scoring works, and are not based on any named commercial product.
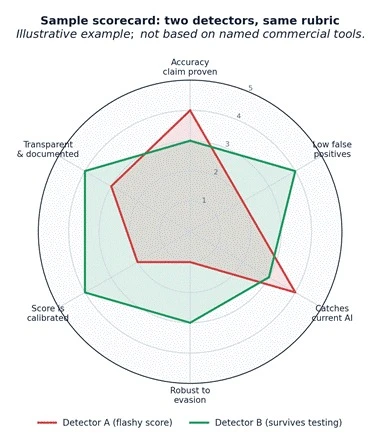
Figure 8. The same rubric, two very different profiles. The flashy score does not survive contact with robustness and calibration.
| Criterion | Weight | Detector A | Detector B |
| Evidence behind the claim | 20% | 4 | 3 |
| False positives on human text | 25% | 2 | 4 |
| Detection of current AI | 15% | 4 | 3 |
| Robustness to evasion | 15% | 1 | 3 |
| Calibration | 10% | 2 | 4 |
| Transparency and bias testing | 15% | 3 | 4 |
| Weighted total (out of 5) | 2.65 | 3.55 |
The headline would have picked Detector A. The rubric picks Detector B, and it picks it for the right reasons: fewer false positives, a score you can believe, and honest documentation. That gap, between the number a tool advertises and the way it behaves under testing, is the entire point of evaluating before you trust.
Even a detector that scores well on this rubric should never be the sole basis for a decision that affects someone. Treat the score as one input among several, alongside context, drafts and version history, a conversation with the writer, and your own reading. The more serious the consequence, the more corroboration the score should require before it is allowed to matter.
▸ A simple policy that holds up Never act on a single score in isolation. Require corroborating evidence. Give the writer a chance to respond before any consequence. Weight short-text and non-native results with extra caution. Re-test your chosen tool periodically, since models keep changing. |
Can any AI detector be fully trusted?
No current tool is reliable enough to be a sole basis for a serious decision. The realistic goal is to find one whose error rate you understand and can live with, and to use its score as one signal among several.
Why do detectors flag non-native English writers so often?
Many rely on perplexity, and writing with a smaller vocabulary and simpler structure reads as more predictable, which the model interprets as machine-like. A 2023 Stanford study found this pushed false-positive rates above 60 percent for one group of essays.
Does a longer passage give a more reliable score?
Generally yes. Reliability tends to rise with length, and several vendors treat roughly 1,000 characters as a practical minimum. Screening a single sentence or a short list is especially risky.
If a detector says 100 percent AI, is it certain?
No. That is a score above a threshold, not proof. Overconfident tools cluster scores near the extremes even when the underlying evidence is far from certain, which is exactly what the calibration test in Step 6 checks.
How often should I re-evaluate a detector I already use?
Whenever major new AI models arrive, and at least a couple of times a year. Detection decays as generation improves, so a tool that tested well last year may not hold up now.
Share your thoughts about this article.
Be the first to post a comment!
Software rarely gets removed. It accumulates. A team hits a snag, someone finds...
Deepak Mehra1 month ago
Picture the last time you called a business after hours. You already know the so...
Pritam Singh1 month ago
Here is the uncomfortable truth about buying an AI chatbot for customer support...
Harpreet Singh1 month ago

Cancelling a ChatGPT subscription takes less than two minutes, once you know whe...
Harpreet Singh1 month ago

AI assistants stopped being optional somewhere in the last two years. Four in fi...
Harpreet Singh2 months ago
Buying an AI tool after reading one polished review can be risky. Some reviews r...
Michael Hicklen3 months ago