Software rarely gets removed. It accumulates. A team hits a snag, someone finds a promising tool, a card gets entered, and the stack grows by one more login that almost never leaves. Repeat that across every department for a few years and the result is predictable.
The scale is now well documented. According to Zylo's 2025 SaaS Management Index, the average company runs around 275 SaaS applications, rising to roughly 660 at large enterprises. Around half of the licenses paid for are never used, and the average organization wastes an estimated 21 million dollars a year on software nobody touches. Gartner has estimated that close to 30 percent of SaaS spend is effectively wasted on idle seats, unused features, and redundant tools.
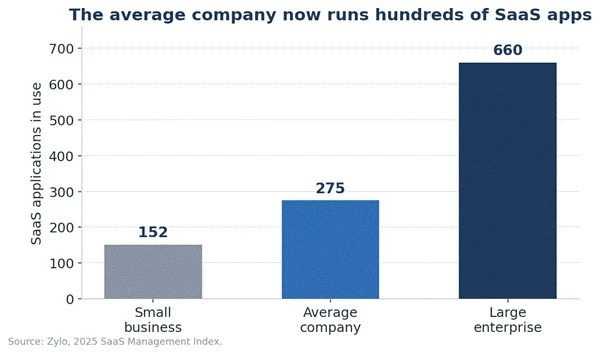
Figure 1. SaaS portfolios have grown into the hundreds of applications at most companies. Each addition is easy in isolation, but the total is what fragments budgets, data, and attention.
The uncomfortable truth is that the highest-leverage question a team can ask is not which tool to add, it is whether to add one at all. The eight questions below form a filter. A tool that clears all eight is usually worth adding. A tool that fails even two or three is usually a future line on next year's waste report. Each question is broken into the same parts: what to ask, why it matters, the outcome it produces, and how to decide, with an example where it helps.
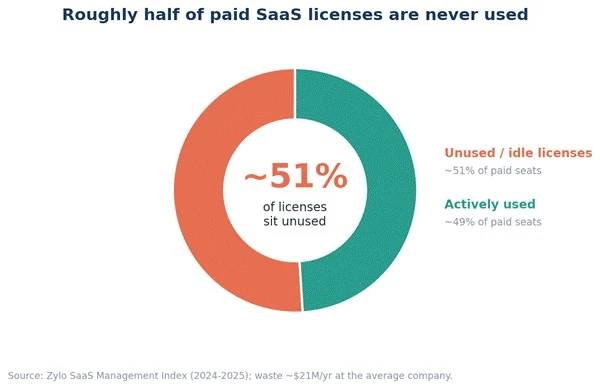
Figure 2. Roughly half of every dollar spent on SaaS seats is idle. The waste is not caused by any single bad purchase; it is the compounding cost of tools added without a filter.
What to ask. Name the specific, recurring pain the tool removes. Who feels it, how often, and what does the current workaround cost in hours or money? Would anyone actually notice if that pain disappeared tomorrow?
Why it matters. Research from MIT Sloan on scaling tools across teams found that the main reason people abandon new software is not resistance to change. It is that the tool solves a problem they do not feel is painful enough to justify altering an established habit. A vague problem produces vague adoption, and vague adoption becomes shelfware inside a quarter.
The outcome. A single-sentence problem statement tied to a named role and a frequency, for example: three writers spend about six hours a week each on first drafts. If that sentence cannot be written honestly, the process should stop here, before any demo is booked.
How to decide. Green light when the workflow, the frequency, and the cost of the status quo can all be named. Red flag when the justification is really “it has AI,” “competitors use it,” or “it looked impressive in the demo.”
Example. A marketing team wants an AI writing assistant. “We should use more AI” is not a decision. “Our three writers lose roughly eighteen hours a week combined on first drafts, and that delays every campaign by a day” is a decision, because it can be measured and later checked.
What to ask. Which tools already in the stack have overlapping capability? Could eighty percent of this job be done by a platform already being paid for? What would it take to extend what exists rather than buy something new?
Why it matters. Overlap is the single biggest hidden source of sprawl. Zylo's data shows the average company runs about fifteen duplicate training apps, eleven project-management tools, and ten collaboration apps. Separate analysis puts the typical company at 7.6 duplicate subscriptions and 4.3 orphaned apps. Most new purchases are not filling a gap, they are re-buying a capability the company already owns.
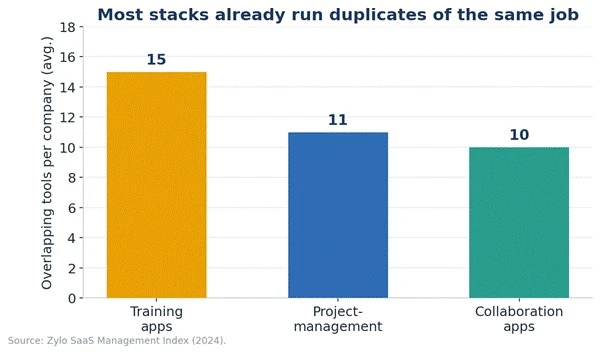
Figure 3. The average stack already contains many tools that do the same job. A new tool should be measured against what is already owned, not against a blank slate.
The outcome. A short capability matrix that maps the candidate tool's core job against the tools already in place. Often it reveals the new tool is largely redundant, or that a feature already exists in a platform the team forgot it had.
How to decide. Run the audit before the purchase, not after. If an owned platform covers the core job at a reasonable quality, extend or configure it. Only proceed when the new tool does something materially better on a job that genuinely matters.
A quick capability check. The point is not to fill every cell perfectly, it is to expose overlap in five minutes:
| Job to be done | Tool we already own | Covers it? | Verdict |
| Short customer surveys | CRM + existing forms | Mostly (80%) | Extend, do not buy |
| Team task tracking | Project-management tool | Yes | Redundant |
| Async video updates | None | No | Genuine gap |
What to ask. Beyond the monthly license, what will implementation, data migration, integration and API work, admin time, training, security review, and eventual switching cost? Is pricing per seat or per usage, and what happens when consumption-based or AI pricing scales up?
Why it matters. The license is a fraction of the real bill. Zylo reports SaaS spend now averages about 4,830 dollars per employee per year, and that 66.5 percent of IT leaders were hit by surprise charges from consumption-based or AI pricing. In its 2026 index, 61 percent of organizations said unplanned SaaS cost increases forced them to cut other projects. A tool that looks cheap monthly can become the reason another initiative gets cancelled.
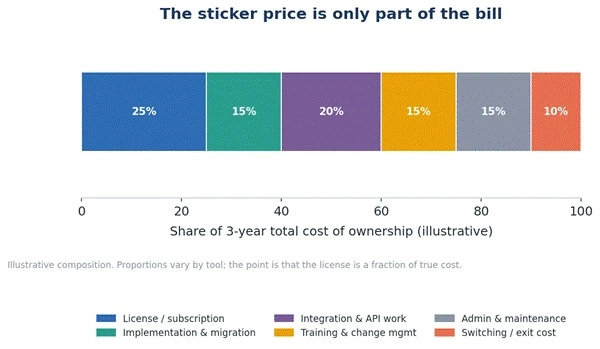
Figure 4. An illustrative view of where the money actually goes. The license is often only a quarter of the three-year cost; integration, training, admin, and exit make up the rest.
The outcome. A three-year, fully loaded cost figure rather than a monthly price, sitting next to the quantified pain from Question 1 so the two can be compared directly.
How to decide. Proceed only when the three-year total cost is clearly smaller than the value of the pain it removes. If the numbers are close, the tool is not worth the added complexity.
A simple TCO worksheet. Filling in even rough numbers changes decisions:
| Cost line | Included? | Notes |
| License / subscription (3 yr) | Yes | Watch annual price increases and auto-renewal. |
| Implementation & data migration | Often missed | One-time, but can rival a year of license. |
| Integration & API work | Often missed | Engineering time; recurring if APIs change. |
| Training & change management | Often missed | The lever that decides adoption. |
| Admin, security review, maintenance | Often missed | Recurring, quiet, and real. |
| Switching / exit cost | Almost never counted | Pay attention before signing, not after. |
What to ask. Does it offer native integrations with the systems of record already in use? How good are the API and its rate limits? Will data flow automatically, or will someone copy and paste between tools? Does it remove a manual step, or simply add another tab to check?
Why it matters. Poor integration is not a minor inconvenience, it is a tax paid by every user. Harvard Business Research found knowledge workers toggle between applications roughly 1,200 times a day, losing close to nine percent of their working time reorienting. Frequent task-switchers make about fifty percent more errors and take roughly forty percent longer on complex work. A disconnected tool spreads that cost across the whole team.
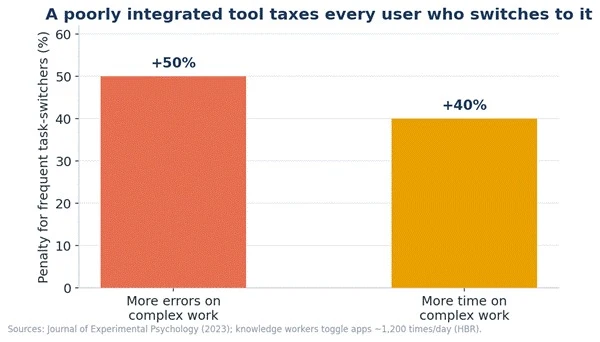
Figure 5. The measured penalty for frequent switching. A tool that forces people to leave their flow and re-enter data quietly degrades both speed and quality.
The outcome. A clear yes or no on whether the tool reduces fragmentation or adds to it, backed by a specific list of the integrations that must exist on day one.
How to decide. Green light when it connects to the systems of record and removes a manual step. Red flag when it becomes “yet another place to check” with data that has to be moved by hand.
Example. A note-taking tool that syncs automatically with the team's chat and CRM saves time. The same tool with no integration, requiring notes to be pasted into three other systems, costs more attention than it saves, no matter how good its core feature is.
What to ask. Is there a named internal owner accountable for the tool? Which roles will adopt it, and how many people is that? Is it being championed by a single person who might leave? Is it being bought quietly outside any central plan?
Why it matters. Ownership is where sprawl is really decided. Zylo's data shows business units control about seventy percent of SaaS spend while IT manages only around twenty-six percent, and roughly one third of applications run as shadow IT, unknown to IT entirely. Tools without a clear owner become the orphaned subscriptions that renew for years after the person who bought them has moved on.
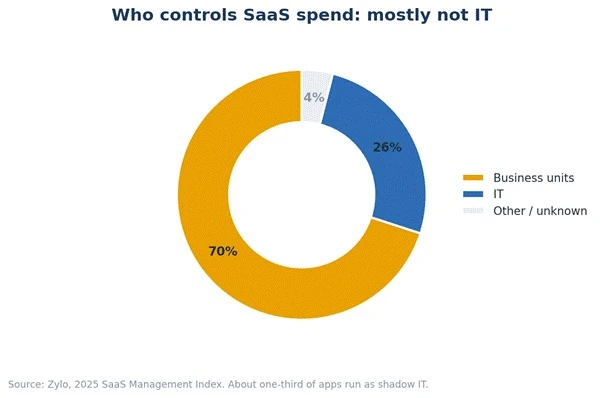
Figure 6. Most SaaS spend is now controlled outside IT. That is not automatically bad, but a tool with no named owner and no visibility is the classic profile of future waste.
The outcome. A named owner, an adoption target expressed as a number of active users, and a review date on the calendar before the tool is ever purchased.
How to decide. No owner means no purchase. If nobody will put their name against adoption and review, the tool is already on the path to becoming shelfware.
Example. A design team lead buys a specialist tool that only she uses well. She leaves eight months later. Nobody else knows the login exists, the license renews automatically, and it becomes one of the average company's 4.3 orphaned apps until a spend audit finally catches it.
What to ask. Where does the data go, and who can see it? Will the vendor train models on the company's data? Are there SOC 2, ISO 27001, and a signed data-processing agreement? Does it support single sign-on and proper access controls? What regulatory exposure does it create, for example under GDPR or India's DPDP Act?
Why it matters. The cost of getting this wrong is not theoretical. The global average cost of a data breach reached 4.45 million dollars in 2025. AI tools raise the stakes further, since data may leave the organization or be used for training in ways that are hard to reverse. With roughly a third of apps invisible to IT, shadow tools are exactly where uncontrolled data exposure hides.
The outcome. A completed security and privacy checklist, reviewed and signed off before rollout, not retrofitted after an incident.
How to decide. This is a hard gate, not a weighted factor. A tool that fails the essentials does not proceed, regardless of how strong the rest of its case is.
Security gate: red flags that should stop a purchase.
| Check | Stop if |
| Data residency & handling | Data leaves permitted regions or is used for model training |
| Certifications & DPA | No SOC 2 / ISO 27001, or no signed data-processing agreement |
| Access control | No single sign-on or role-based access for a tool holding real data |
| Regulatory fit | Creates GDPR / DPDP exposure with no clear controls |
What to ask. What single metric will prove the tool delivered value? Has the baseline been captured before rollout? When are the 30, 60, and 90 day reviews, and what result at each point would justify stopping?
Why it matters. Counting licenses or logins measures activity, not value. Without a success metric and a defined kill threshold set in advance, sunk cost and internal politics take over, and tools survive on inertia rather than merit. Deciding the kill criteria before the tool is emotionally embedded is what makes an honest review possible later.
The outcome. One success metric, a captured baseline, a review cadence, and a kill threshold, all written down before purchase.
How to decide. If success cannot be defined, or nobody will commit to a kill rule, that is itself the answer: do not buy.
| Element | Example | Why it is set now |
| Success metric | First-draft time cut 40% | Ties value to Question 1's pain |
| Baseline | 18 hrs/week today | Cannot prove change without it |
| Review cadence | Day 30 / 60 / 90 | Catches the abandonment window |
| Kill threshold | <50% active use at day 60 | Removes emotion from the call |
What to ask. Can the company export its data, and in what format? What is the contract length, and does it auto-renew? How is cancellation handled, and how much notice is required? How locked-in does this tool make the team, and what would offboarding actually involve?
Why it matters. Auto-renewals and data lock-in are what turn a failed experiment into a multi-year expense. An unused license that renews silently is the mechanism behind much of the industry's wasted spend. Knowing the exit before signing keeps a bad fit from becoming a permanent one.
The outcome. A documented offboarding plan and written confirmation that the company's data can be exported cleanly, agreed before the contract is signed.
How to decide. For anything unproven, prefer month-to-month or short terms, and confirm data portability in writing. If leaving would be painful and the tool is not yet proven, that risk alone can be reason enough to wait.
Exit checklist to clear before signing:
● Data export is confirmed in a usable, standard format.
● Contract term is as short as the tool's maturity warrants; auto-renewal is understood.
● Cancellation notice period and process are documented.
● Offboarding steps, including who does what, are written down in advance.
The eight questions work best as a single scored gate rather than a loose checklist. Weight each question by how much it matters for the specific decision, score the candidate tool from one to five on each, and multiply. Two questions, security and exit, are treated as hard gates: a serious failure on either stops the decision regardless of the total. The example below scores a hypothetical AI note-taking tool.
| Question | Weight | Score (1-5) | Weighted |
| 1. Real, painful problem | 20% | 4 | 0.80 |
| 2. Not already owned | 15% | 3 | 0.45 |
| 3. True cost of ownership | 15% | 3 | 0.45 |
| 4. Clean integration | 20% | 4 | 0.80 |
| 5. Owner & adoption | 15% | 4 | 0.60 |
| 6. Security & compliance | Gate | Pass | Proceed |
| 7. Metrics & review set | 10% | 4 | 0.40 |
| 8. Exit plan | Gate | Pass | Proceed |
| Total (of 5.0) | 3.50 → Proceed |
How to read the score. A weighted total at or above roughly 3.5 out of 5, with both gates passed, is a reasonable threshold to proceed. Between 2.5 and 3.5, the tool is a maybe worth revisiting after fixing the weak areas, often integration or ownership. Below 2.5, or a failed gate, is a no. The thresholds matter less than the discipline of scoring honestly before money is committed.
The best tech stacks are curated, not accumulated. Every application in a stack is a standing cost in money, attention, integration, and risk, and that cost is paid every month whether or not anyone still uses the tool. The data on sprawl, with hundreds of apps per company, half of licenses idle, and tens of millions wasted each year, is simply what happens when tools are added without a filter.
These eight questions are that filter. They will not make every decision easy, but they will make the expensive mistakes visible before the contract is signed rather than a year later on a waste report. When a tool clears all eight, it has earned its place. When it does not, the most valuable thing a team can do is the hardest: say no, and keep the stack lean enough that the tools that remain can actually do their job.
Share your thoughts about this article.
Be the first to post a comment!

⚑ The short versionAn AI detector returns a probability, not a verdict. Th...
Sakshi Dhingra1 month ago
Picture the last time you called a business after hours. You already know the so...
Pritam Singh1 month ago

Here is the uncomfortable truth about buying an AI chatbot for customer support...
Harpreet Singh1 month ago
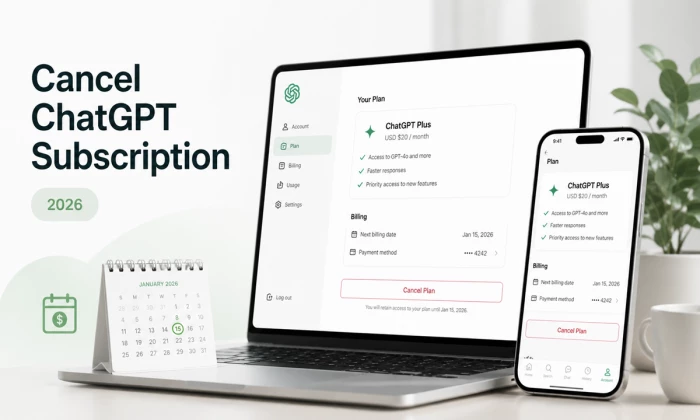
Cancelling a ChatGPT subscription takes less than two minutes, once you know whe...
Harpreet Singh2 months ago
AI assistants stopped being optional somewhere in the last two years. Four in fi...
Harpreet Singh2 months ago
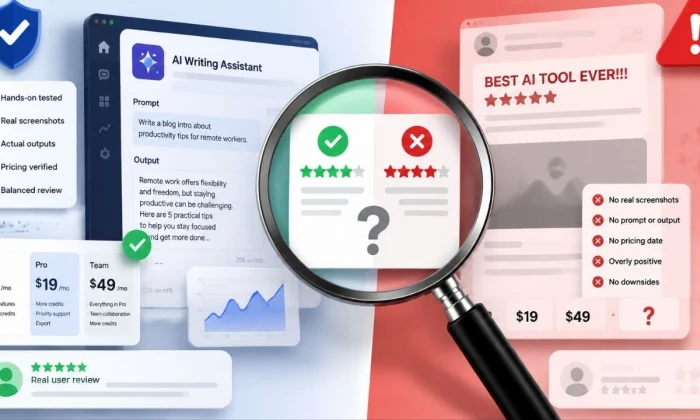
Buying an AI tool after reading one polished review can be risky. Some reviews r...
Michael Hicklen3 months ago